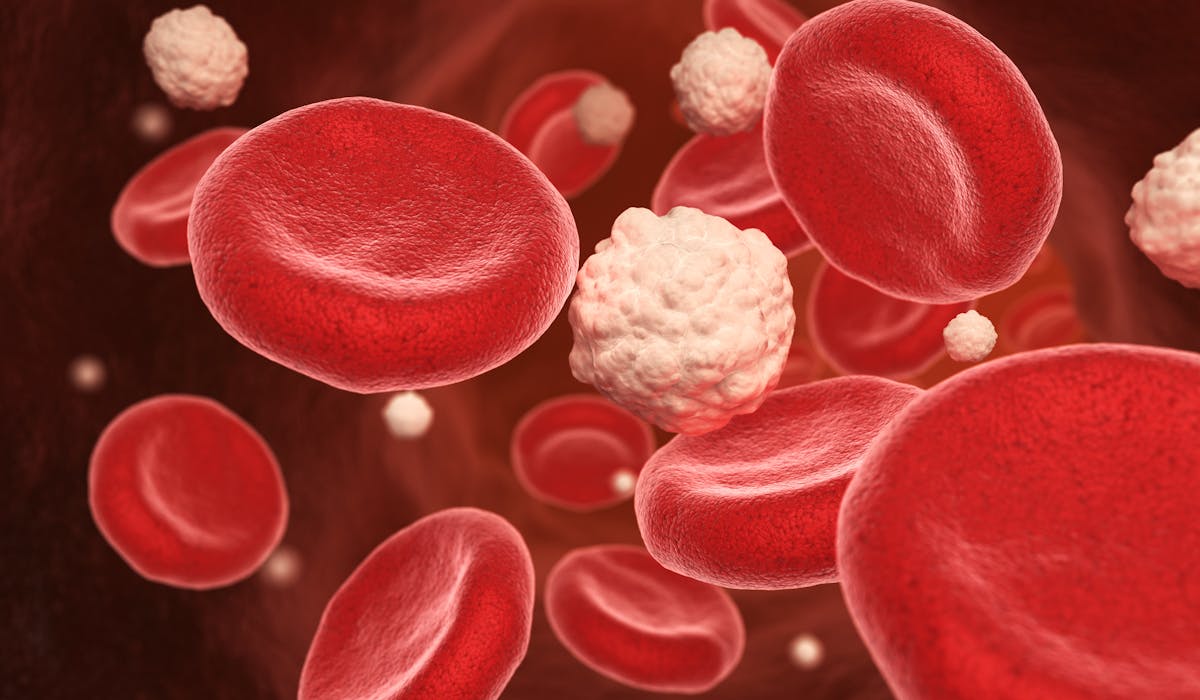
Understanding HbA1c — the long-term blood sugar
Have you recently had an HbA1c blood test? It is quite likely that at least once a year you will have one. It’s a common and important test that can measure your long-term average blood sugar levels.
This guide will help you interpret your HbA1c results, and explain why HbA1c is an important way to measure metabolic health. We’ll also explain reasons for occasional unexpected variations in HbA1c results and the strengths and weaknesses of the test.
What is HbA1c and why does it matter?
Hemoglobin A1c (HbA1c, or sometimes just called an A1c) is a way to assess your average blood glucose levels. It differs from a fasting glucose measurement in that fasting glucose is a snapshot of your blood glucose level at that one moment in time, when you first wake up in the morning before eating. The HbA1c, however, is a longer-term measurement that reflects your average blood sugar over the previous three months.1
It can measure this longer time frame because hemoglobin, which transports oxygen in your blood, is a protein that glucose sticks to over time. The more sugar in your blood, the more it sticks to the hemoglobin. When any protein becomes sticky with sugar in this way it’s called glycation or glycosylation.
So rather than measuring the amount of glucose in a drop of blood, HbA1c measures the percentage of glucose stuck to the hemoglobin in your blood, or in medical terms, the percentage of glycation of the hemoglobin.
How do you interpret HbA1c numbers?
HbA1c is an important measure because it can be used to diagnose type 2 diabetes or pre-diabetes. It can also be used to monitor how well you are managing your blood sugar levels if you have type 2 diabetes or pre-diabetes, especially if you’ve made changes to your diet and lifestyle.
The American Diabetes Association (ADA) uses the following cutoff points for HbA1c:2
- Normal: less than 5.7%
- Pre-diabetes: 5.7% to 6.4%
- Type 2 diabetes: 6.5% or higher
A diagnosis of type 2 diabetes or pre-diabetes should usually not be made using only one measurement of your HbA1c. The test should be repeated to confirm that the results are consistent or it should be used in conjunction with a fasting blood glucose, a CGM recording, or an oral glucose tolerance test to confirm the diabetes diagnosis.
HbA1c and average blood glucose
HbA1c result can be translated into an estimated average daily glucose level. Here are the averages and ranges the ADA uses:3
Maintaining blood sugar within a normal range is critically important for long-term health. Does that mean, however, that you’re totally fine if your level is consistently 5.6% or below?
Not necessarily.
When your HbA1c is bordering the cuttoffs for pre-diabetes, and your results are trending up, it can be an indicator that you are already experiencing vascular effects of high blood sugar and may be on your way to an eventual type 2 diabetes diagnosis.4
If your HbA1c is obviously quite high — regularly in the type 2 diabetes range— that is a clear indication that your blood glucose is elevated most of the time and you should explore ways to help bring it down to a healthier level, such as with a low-carb or ketogenic diet or intermittent fasting.
Why do low-carb diets often lower HbA1c?
Since HbA1c is an indicator of your long-term blood glucose level, it makes sense that strategies to lower your daily blood glucose levels would also lower your HbA1c. Low-carb and ketogenic diets are powerful ways to do this. If you are not eating sugar, or carbohydrates that rapidly digest to sugar, you won’t have excess sugar circulating in your blood.5
Blood glucose may improve so quickly on a ketogenic diet that some people with type 2 diabetes need to reduce or discontinue their insulin on the very first day of adopting the diet.6 (Always work with a physician or other qualified medical professional for this. Do not adjust medications on your own.)
Low-carb and keto eating, however, aren’t the only ways to lower HbA1c. This can also be accomplished with a low-glycemic diet, intermittent fasting, and even by incorporating more exercise into your life without much of a change in diet.7
Most of the research comparing low-carb and keto diets to other ways of eating, however, shows that carb restriction is more effective, and moreover, it’s effective even without exercise.
In a study comparing different interventions in overweight individuals with type 2 diabetes, pre-diabetes, or metabolic syndrome, subjects who followed a ketogenic diet for 10 weeks (<30 g carbs per day) but did not exercise had much greater reductions in HbA1c than subjects who followed a standard American diet and exercised three to five days per week.8
The American Diabetes Association recently issued a consensus report in which they acknowledged the effectiveness of low-carb and very low-carb diets for improving blood sugar control. The consensus panel noted that multiple meta-analyses have shown that these carbohydrate-restricted ways of eating typically lower HbA1c more than low-fat diets.9
With regard to improving blood glucose control, and thereby improving HbA1c results, the ADA panel wrote: “reducing overall carbohydrate intake with low- or very low-carbohydrate eating plans is a viable approach.”10
Videos about low carb
Strengths and shortcomings of HbA1c
The HbA1c has strengths and shortcomings. One strength is that it’s more informative than a fasting blood glucose. Fasting glucose can be elevated for a number of reasons even on a low-carb or keto diet, such a bad night’s sleep, and as noted, it’s only a one-time snapshot. HbA1c is a better approximation of your blood glucose levels over the course of many weeks.
A major shortcoming, however, is that the HbA1c provides no information about insulin levels. It’s possible — common in fact — to have a normal HbA1c but very high insulin.11 Elevated insulin levels mean your pancreas is working hard to keep your blood glucose at normal levels. Chronically high insulin is a major driver of metabolic disease even when fasting glucose and HbA1c are normal.12
Another shortcoming of HbA1c is that it’s based on the assumption that red blood cells (RBCs) live approximately 120 days. However, for reasons we’ll explore shortly, this is not always the case. HBA1c therefore may not be a completely accurate reflection of average blood glucose in people whose RBCs have a shorter or longer lifespan.13
However, while the absolute number may be open to interpretation, the trend in the results of your HbA1c can be very helpful. For instance, if your red blood cells have a longer half life, your absolute A1c will tend to be higher. However, if that number goes down over time as you lose weight or embark on other lifestyle changes, then that trend information is very useful feedback that your blood sugar control is improving. And if your HbA1c is trending up, that means you need to pay attention to bringing your blood sugar back under control.
Reasons why your HbA1c might be higher or lower than expected
In some cases, the HbA1c may not be a completely accurate proxy for estimated average blood glucose. In fact, some people with very poor blood glucose control may have a lower-than-expected HbA1c, while those with excellent blood glucose control may have an HbA1c that’s slightly higher than expected. That may be because of any of these factors:
- Shorter RBC lifespan: Chronically elevated blood glucose may be damaging to RBCs, which may shorten their lifespan to less than 120 days in someone with poorly-controlled type 2 diabetes.14
A shorter lifespan means these cells have less time for blood sugar to stick to them (to become glycated). In such a situation, it’s unlikely that someone would have an HbA1c in the non-diabetic range, but it might be lower than would be expected, leading individuals and their physicians to believe their diabetes is better controlled than it actually is. One case series reported the higher the HbA1c, the shorter the RBC lifespan — as short as 81 days — and the greater the underestimation of the actual blood glucose level.15
- Longer RBC lifespan: While no research has yet confirmed this assumption, many low carb researchers hypothesize that healthy people — or people who have recently adopted a low carb diet — may have longer RBC lifespans. At this stage, however, this is conjecture.
However one study did show that in people who don’t have diabetes, RBCs can live as long as 145 days — more than three weeks longer than the typically cited 120-day average.16 This longer life span could give the cells more time to become glycated, which could result in an artificially high HbA1c.
In these individuals fasting glucose would likely be normal and glucose after meals would be normal as well. People in this scenario would likely not have an HbA1c in the diabetic or pre-diabetic range, but it might be higher than they would otherwise expect — for example, 5.4% rather than 5.0%. - Anemia: Another factor affecting RBC lifespan and, therefore HbA1c, is anemia. Some types of anemia result in a shortened lifespan for RBCs, contributing to an artificially low HbA1c. However, iron deficiency anemia may be associated with higher HbA1c in both people with diabetes and without.17In fact untreated iron deficiency anemia can misclassify people as having diabetes. One study’s authors note: “Iron deficiency must be corrected before any diagnostic or therapeutic decision is made based on HbA1c.”18
- Genetic factors: Ethnic and genetic factors may influence RBC structure, and may therefore influence RBC lifespan and HbA1c. People of African, Mediterranean, or Southeast Asian descent may have hemoglobin variants that influence the accuracy of HbA1c.19 Other variants are found in individuals from other parts of the world. Some laboratories take hemoglobin variants into account in their tests, but others don’t. These variants include genes for sickle cell anemia and beta thalassemia.20
Other ways to assess glycemic control beyond HbA1c
HbA1c can be helpful when assessing metabolic health, but is best when used as part of a larger picture. Here’s a quick look at some additional ways to evaluate your blood sugar control and metabolic health:
- Fasting insulin test or HOMA-IR: As mentioned earlier, many people have high insulin levels even when their HbA1c and fasting glucose are normal. A fasting insulin test can tell you whether your fasting insulin level is high, and combining fasting insulin with fasting glucose gives your homeostatic model assessment of insulin resistance (HOMA-IR).21
The HOMA-IR may be a more informative measurement than either fasting insulin or glucose by themselves because it helps you see the relationship between insulin levels and blood glucose levels, and tells you how insulin sensitive or insulin resistant you are.
- Fructosamine: Similar to HbA1c, fructosamine levels indicate your glycemic control but during the previous two to three weeks rather than months.22 Fructosamine is a compound formed when glucose sticks to other proteins in the blood that only exist for 14 to 21 days. The percentage of glycated proteins in the fructosamine test reflects average glucose levels during this shorter timeframe. It is not believed to be affected by red blood cell lifespan.
In addition to being an indicator of glycemic control, fructosamine can be useful for gauging the recent impact of changes in diet, medication, and lifestyle. (However, fructosamine is not a routine test and may not be available everywhere.)
- Glycated albumin: Albumin is one of the most abundant proteins in blood, and sugar in the blood sticks to it over time. Its percentage of glycation reflects mean glucose levels over the prior two to three weeks.23 This test is relatively new and is not widely available.
- Continuous glucose monitor (CGM): Measuring blood glucose in real-time with a CGM provides very useful data about your blood sugar levels. If you’ve been surprised by an HbA1c that’s higher than you expected, a CGM may show you more reliably what your blood glucose is doing after meals and throughout the day.
- HbA1c plus an oral glucose tolerance test (OGTT): Drinking a 75g glucose solution and measuring your immediate blood sugar response, called an OGTT, can assess your blood sugar control when combined with the results of your HbA1c. In fact, one study found that, based solely on HbA1c, 73 % of subjects appeared to have normal blood glucose levels, but the OGTT showed that their blood glucose rose into the diabetic range.24 Do note, if you’ve been following a low-carb or ketogenic diet, the OGTT may give a false result. Most keto-friendly physicians recommend that you “carb up” by consuming 150 grams of carbs daily for a minimum of three days prior to taking the test in order to prepare your body to once again burn carbs — otherwise it may falsely indicate that you have diabetes. However, at least one study suggests it may take more than a week to completely adapt to eating higher carbs.25
- Triglyceride to HDL ratio: A fasting blood test that looks at the relationship between your triglycerides and your high-density lipoprotein (HDL) provides information about your metabolic health without measuring blood glucose at all.
To get the ratio divide your triglyceride number by your HDL number. The closer the ratio is to 1 the better, with the cut off for a “low” ratio being 1.7 — as long as the HDL is above 40 mg/dL. The higher the triglycerides and the lower the HDL, the higher the ratio, with a hazardous ratio being anything above 3.0.26A high TG-HDL ratio is part of the diagnostic criteria for metabolic syndrome and insulin resistance and predicts increased risk for type 2 diabetes as well as cardiovascular disease and heart attacks.27
- Waist to height ratio or waist to hip ratio: The size of your waist in relation to your height, or in relation to your hips, are both indicators of metabolic health and insulin sensitivity. Greater abdominal circumference is related to a greater risk of diabetes, hypertension, cardiovascular disease and overall mortality even in people of normal weight.28
To get your ratios just divide your waist measurement by either your height or hip measurement to get a number. Or you can use an online calculator. A waist to height ratio less than 0.5 indicates good insulin sensitivity, while a higher number indicates insulin resistance. Likewise, a waist to hip ratio of less than .9 for men and .85 for women is healthy.
Summary
HbA1c is a very important measurement of your metabolic health that should ideally be taken regularly — perhaps once a year — by your doctor. If you have received a diabetes diagnosis it should be taken more often, perhaps once every three months.
The trend of your HbA1c results over time gives you a good indication of your blood sugar control. Lifestyle changes like low carb eating, intermittent fasting, and increased exercise can improve blood sugar levels and your A1c.
Like any other health marker, however, a single HbA1c result does not give a complete picture of your health. It helps to work with a qualified medical professional to understand the total picture of your health, using different clinical measurements as well as your own assessment of how you feel.
Start your FREE 7-day trial!
Get instant access to healthy low-carb and keto meal plans, fast and easy recipes, weight loss advice from medical experts, and so much more. A healthier life starts now with your free trial!
Start FREE trial!Understanding HbA1c — the long-term blood sugar - the evidence
This guide is written by Amy Berger, Dr. Bret Scher, MD and was last updated on June 19, 2025. It was medically reviewed by Dr. Bret Scher, MD on November 5, 2021.
The guide contains scientific references. You can find these in the notes throughout the text, and click the links to read the peer-reviewed scientific papers. When appropriate we include a grading of the strength of the evidence, with a link to our policy on this. Our evidence-based guides are updated at least once per year to reflect and reference the latest science on the topic.
All our evidence-based health guides are written or reviewed by medical doctors who are experts on the topic. To stay unbiased we show no ads, sell no physical products, and take no money from the industry. We're fully funded by the people, via an optional membership. Most information at Diet Doctor is free forever.
Read more about our policies and work with evidence-based guides, nutritional controversies, our editorial team, and our medical review board.
Should you find any inaccuracy in this guide, please email andreas@dietdoctor.com.
Biomarker Insights 2016: Significance of HbA1c test in diagnosis and prognosis of diabetic patients[overview article; ungraded] ↩
Diabetes care 2010: Diagnosis and classification of diabetes mellitus[overview article; ungraded] ↩
Diabetes care 2008: Translating the A1C assay into estimated average glucose values[overview article; ungraded] ↩
Journal of the American College of Cadriology 2021: Glycated hemoglobin and subclinical atherosclerosis in people without diabetes[observational study; weak evidence] ↩
Scandinavian Cardiovascular Journal 2008: Carbohydrate restriction as the default treatment for type 2 diabetes and metabolic syndrome [overview article; ungraded]
Nutrition 2015: Dietary carbohydrate restriction as the first approach in diabetes management: critical review and evidence base [review article; ungraded] ↩
British Journal of General Practice 2019: Adapting diabetes medication for low carbohydrate management of type 2 diabetes: a practical guide[overview article; ungraded] ↩
Diabetes care 2003: Low–glycemic index diets in the management of diabetes [systematic review of randomized trials; strong evidence]
BMJ Case Reports 2018: Therapeutic use of intermittent fasting for people with type 2 diabetes as an alternative to insulin [case report; weak evidence]
Diabetes Care 2006: Effects of different modes of exercise training on glucose control and risk factors for complications in type 2 diabetic patients [systematic review of randomized trials; strong evidence]
↩Diabetes & Metabolic Syndrome: Clinical Research & Reviews 2017: Induced and controlled dietary ketosis as a regulator of obesity and metabolic syndrome pathologies [randomized control trial; moderate evidence] ↩
Interestingly, the differences tend to get smaller over time. This might not be because low-carb stops being more effective, but rather, because some people may have difficulty sticking to the diet after a while, so they may inadvertently start eating more carbs.
Diabetes Care 2019: Nutrition Therapy for Adults With Diabetes or Prediabetes: A Consensus Report [report; ungraded] ↩
Diabetes Care 2019: Nutrition therapy for adults with diabetes or prediabetes: A consensus report [report; ungraded] ↩
Diabetes care 2008: Insulin Resistance and Hyperinsulinemia[overview article; ungraded] ↩
The Journal of Medical Practice Management 2016: Ketogenic weight loss: The lowering of insulin levels is the sleeping giant in patient care [overview article; ungraded]
Diabesity 2015: Hyperinsulinemia: A unifying theory of chronic disease? [overview article; ungraded]
Journal of Insulin Resistance 2016: Hyperinsulinemia and insulin resistance: Scope of the problem [overview article; ungraded]
Comparative Biochemistry and Physiology Part A: Molecular & Integrative Physiology 2003: Hyperinsulinemic diseases of civilization: more than just Syndrome X? [expert opinion; weak evidence] ↩
Clinical Chemistry 1993: Influence of hemoglobin variants and derivatives on glycohemoglobin determinations, as investigated by 102 laboratories using 16 methods[non-controlled study; weak evidence] ↩
Journal of Diabetes Research 2021: The relationship between erythrocytes and diabetes mellitus[overview article; ungraded] ↩
Diabetes Care 2004: Relationship between GHb concentration and erythrocyte survival determined from breath carbon monoxide concentration [case series; weak evidence] ↩
Journal of Laboratory and Clinical Medicine 2003: Simplification of the end-alveolar carbon monoxide technique to assess erythrocyte survival [case series; weak evidence] ↩
Iranian Biomedical Journal 2014: Influence of iron deficiency anemia on hemoglobin A1C levels in diabetic individuals with controlled plasma glucose levels [case series; weak evidence] ↩
Acta Haematologica 2004: Effect of iron deficiency anemia on the levels of hemoglobin A1c in nondiabetic patients [case series; weak evidence] ↩
Journal of the Royal Society of Medicine 2001: Disorders of hemoglobin: Genetics, pathophysiology, and clinical management[overview article; ungraded]
Journal of Diabetes Science snd Technology 2009: A review of variant hemoglobins interfering with hemoglobin A1c measurement[overview article; ungraded] ↩
Dr. Peter Attia has written about his personal experience with this. Of Mediterranean ancestry, he carries a gene for beta thalassemia, a type of anemia that affects hemoglobin production and RBC size. His continuous glucose monitor showed that he had excellent average blood glucose control (92 mg/dl (5.1 mmol/L), which would correlate to an HbA1c of 4.6 to 4.9 %. However, his HbA1c lab tests were typically 5.5 to 6.0% — not just substantially higher, but in the pre-diabetes range. ↩
Drug Discoveries and Therapeutics 2015: Optimal cut-off values for the homeostasis model assessment of insulin resistance (HOMA-IR) and pre-diabetes screening: Developments in research and prospects for the future[overview article; ungraded]
Diabetes Care 2002: HOMA-estimated insulin resistance is an independent predictor of cardiovascular disease in type 2 diabetic subjects[non-controlled study; weak evidence]
↩Journal of Diabetes Science and Technology 2015: Advantages and pitfalls of fructosamine and glycated albumin in the diagnosis and treatment of diabetes[overview article; ungraded]
Annals of Pediatric Endocrinology & Metabolism 2015: Clinical usefulness of the measurement of serum fructosamine in childhood diabetes mellitus [case series; very weak evidence] ↩
PLoS One 2019: Glycated albumin as a diagnostic tool in diabetes: An alternative or an additional test?[non-controlled study; weak evidence] ↩
Endocrine Society Press Release 2019: A1c test misses many cases of diabetes [conference presentation; weak evidence] ↩
Diabetes 1979: Classification and diagnosis of diabetes mellitus and other categories of glucose intolerance. National Diabetes Data Group [overview article; ungraded]
Diabetes care 2022:
Prolonged glycemic adaptation following transition from a low- to high-carbohydrate diet: A randomized controlled feeding trial[moderate evidence] ↩Journal of the American Medical Association 2001: Low triglycerides–high high-density lipoprotein cholesterol and risk of ischemic heart disease [observational prospective cohort study; weak evidence] ↩
Clinics 2008: High Ratio of triglycerides to HDL-cholesterol predicts extensive coronary disease [case series; weak evidence] ↩
BMJ Open 2016: Waist-to-height ratio as an indicator of ‘early health risk’: simpler and more predictive than using a ‘matrix’ based on BMI and waist circumference [Retrospective observational study; weak evidence]
World Health Organization 2011: Waist circumference and waist–hip ratio: Report of a WHO expert consultation [expert review; weak evidence] ↩
